Visualizing the emotions of a city
This is a quick project I did over the course of a night or two using some parts I had laying around and had been looking for an excuse to use.
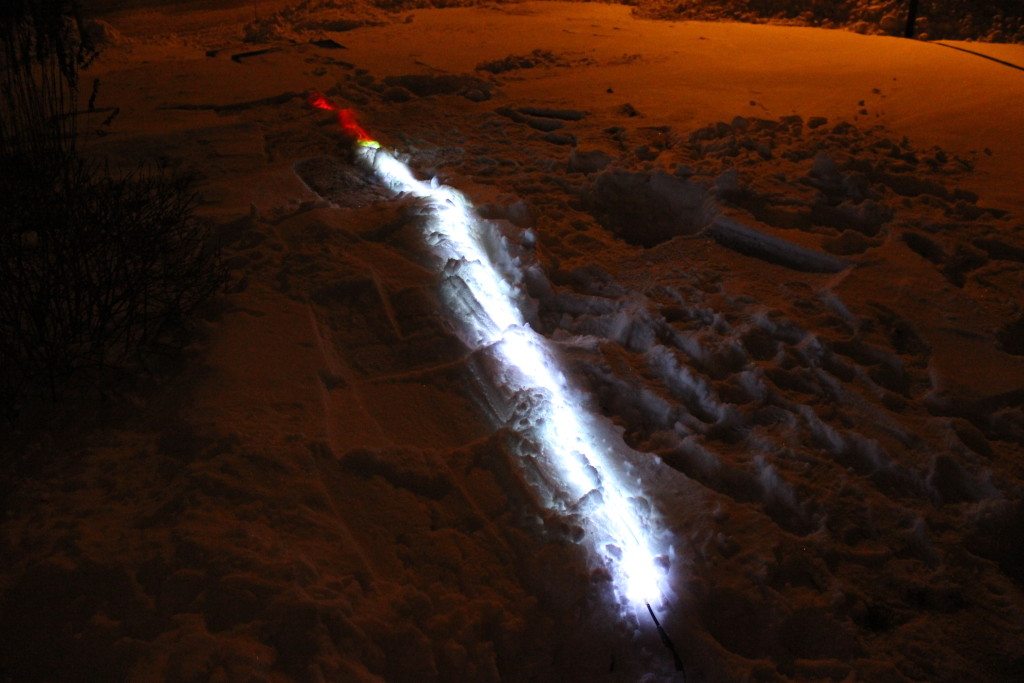
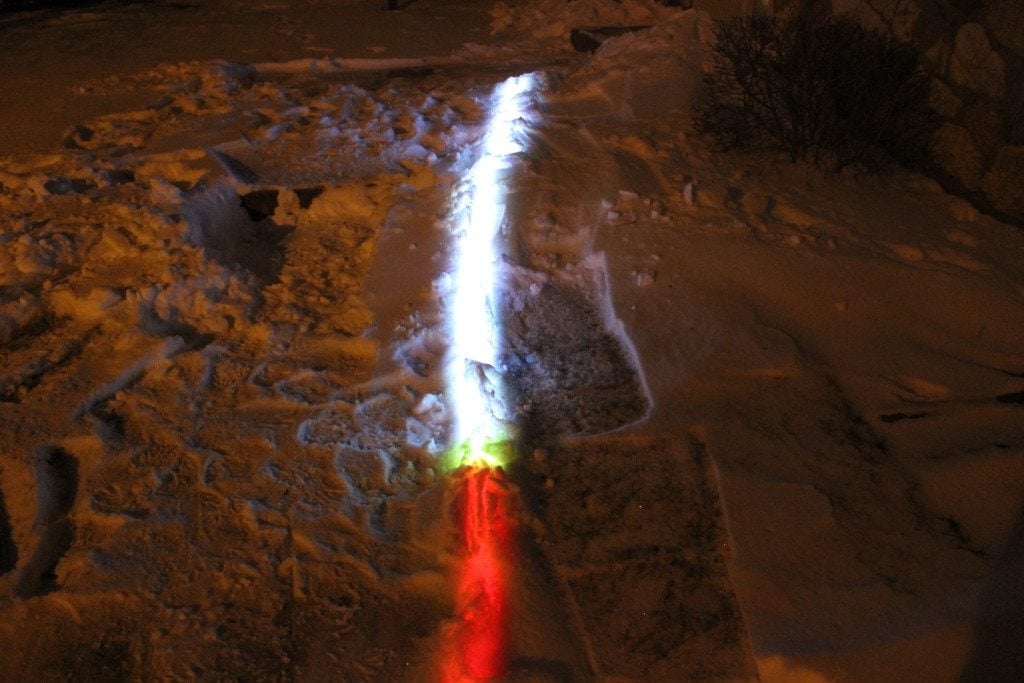
An Arduino connects to the internet with an Ethernet shield and sends the latest tweets from within 15 miles of my location to the Alchemy sentiment API. The result is plotted. Obviously the thing that’s really plotted is not the emotions of the entire city, but of the people who are tweeting. But it’s still interesting and given that I live in the suburbs that are full of high school students, maybe it’s accurate after all (especially if their mood affects their parents). And obviously tweeting about negative or positive things doesn’t directly mean that people are happy or sad or angry, but it’s at least loosely coupled to that, and besides, this is an art project, so give me a break!
The sentiment range is not huge, so rather than plotting the sentiment directly (which would only cause a few segments to change across the entire strip), it plots the change in sentiment since the last sample. That ends up looking much better.
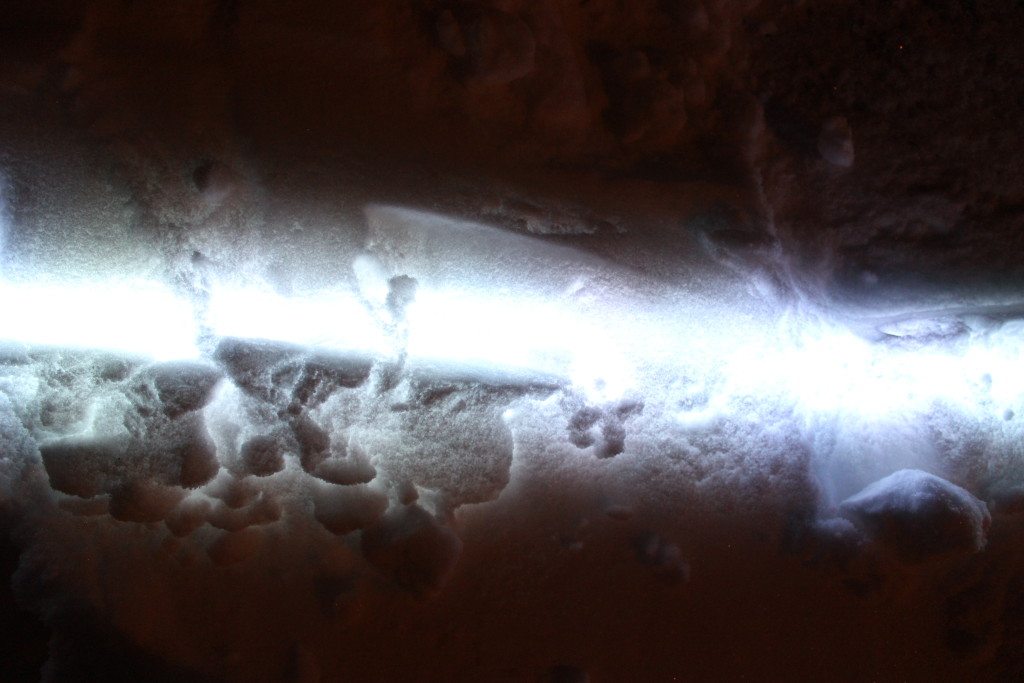
The snow is very good at diffusing the light. When the strip is just laying on my floor, it’s very easy to see each LED, so you end up with a dotted line effect. When you cover it in about 2 inches of snow, it’s impossible to see individual LEDs and the light looks continuous. I tried several experiments with different depths of snow and packing hard versus sprinkling it on. How hard it’s packed didn’t make that much difference, and the depth sweet spot seemed to be between 2 and 5 inches. Too little and you can see the individual lights, too deep and the light gets too dark.
I had this project ready to go for Christmas time, but we didn’t have snow then! I had to wait a little while for some decent snowfall. I noticed that after prolonged exposure to very cold temperatures, some of the LEDs stopped lighting up. Once I took the strip inside and it warmed up, they came back on. The strip I used was literally the cheapest one from China I could find, so that isn’t too surprising.
I originally wanted to make my entire front yard a LED display with rows of these strips, but that was going to end up being too expensive. Still, maybe next year we’ll see more people use data to drive their Christmas lights instead of a boring old timer or nothing at all.
I thought about plotting other things as well, like temperature or something. I also thought about taking advantage of the fact that lots of people would see it as they drove by, but no one would know what it meant, so I could put something really personal on it like my current bank balance or my last transaction. But I ended up picking sentiment analysis because I thought it would be interesting. Plus I’ve been on a twitter scraping rampage lately. More on that later…


Pingback: Display Your City’s Emotional State with Illuminated Snow | Hack The Planet
Pingback: Illuminate your city’s mood in the snow | Bits & Pieces from the Embedded Design World
Pingback: Illuminate your city’s mood in the snow | Atmel Bits & Pieces